Median family income
$103,984 Riverside County
$113,346 California | $99,999 United States
All-family median, not subgroup income.
The 825 / family income and poverty
Compare income and family poverty with the populations, periods and unanswered questions left in.
Riverside County example. ACS 2020-2024 pooled estimates. Family income is in 2024 inflation-adjusted dollars. These figures describe families, not all households.
$103,984 Riverside County
$113,346 California | $99,999 United States
All-family median, not subgroup income.
8.07% Riverside County
8.53% California | 8.76% United States
Share below official poverty thresholds within this family category.
11.01% Riverside County
12.21% California | 13.37% United States
Share below official poverty thresholds within this family category.
Point estimates only. Original source 90% margins are included in the packages. Derived rate and gap uncertainty is not calculated, so no significance ranking is claimed.
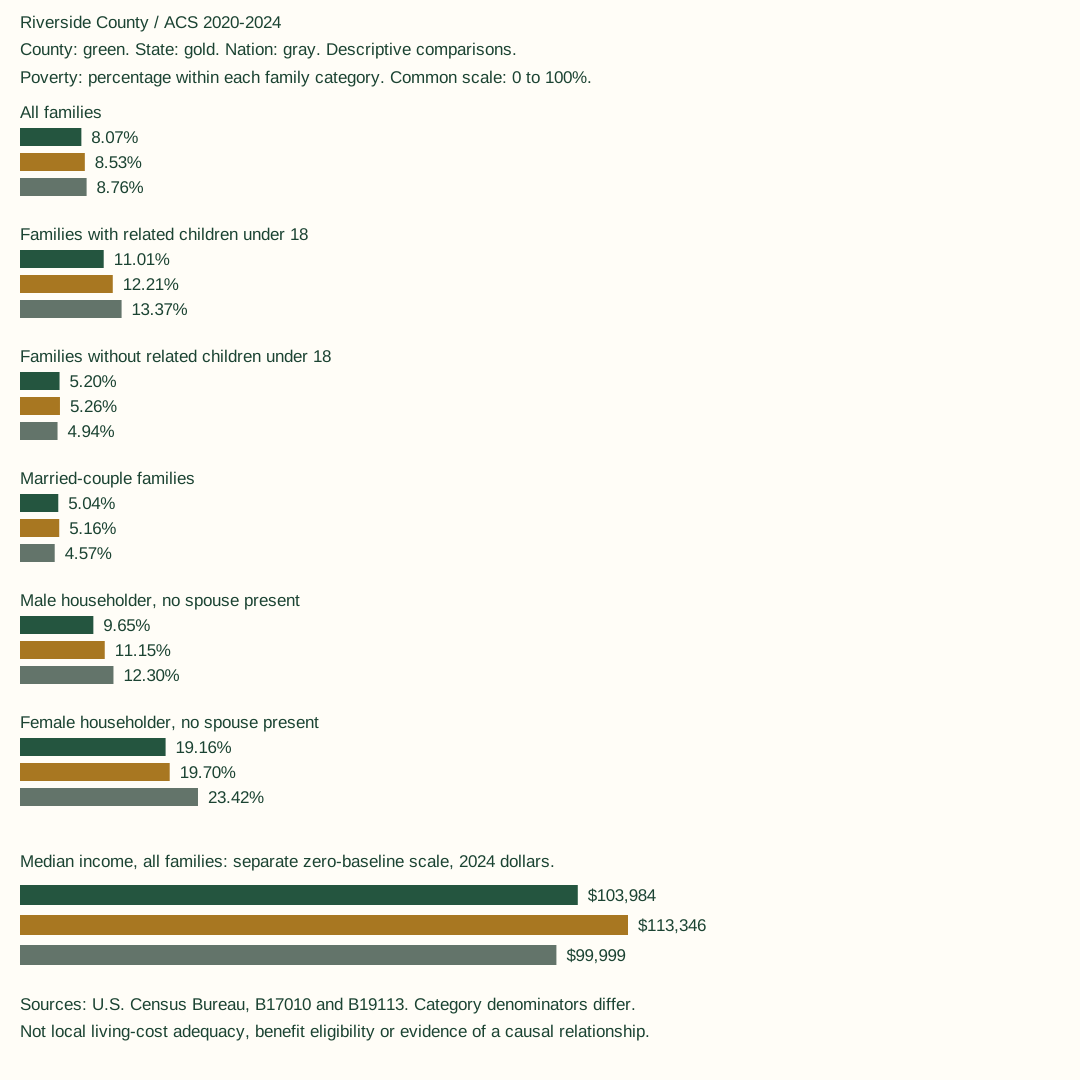
Income uses a different scale from poverty percentages. Family-type and child-presence categories overlap. Do not add them or infer that family structure caused the differences.
Compare actual housing, care, transport and work costs with your own circumstances. These area estimates do not decide eligibility or predict your income.
Use subgroup denominators and local provider evidence to frame questions. A high median does not establish that all families have adequate resources.
Keep source table, population, geography, period, units and missing values attached to each figure. Do not turn an aggregate association into an individual diagnosis.
Each state package includes all its counties, six family-poverty comparisons and the all-family income median, with state and national benchmarks. Government sources remain free. The paid editions add preparation, context and supporting files.
Find this package for another state | Agent checkout contract
Census B17010: family poverty | Census B19113: family income | How Census measures poverty
Related children under 18 are the source category, not every parent or child. No spouse present does not mean only one adult lives in the household. These data do not provide current service availability, a local cost budget, program eligibility, individual mobility or a causal result.